This report is released at a critical moment in global climate governance. As the Seventh United Nations Environment Assembly convenes and the Paris Agreement marks its tenth anniversary, questions surrounding the attribution of climate responsibility have gained renewed international attention. In recent diplomatic discourse, intensified debate has emerged over whether annual greenhouse gas emissions alone can serve as a fair basis for assigning national responsibility. To help clarify this complex issue, Fact Hunter draws on internationally recognized scientific models and institutional frameworks to provide a more balanced, evidence-based assessment.
Claim
During the United Nations Security Council open debate on “Climate and Security” on 6 November 2025, the U.S. representative asserted that “China currently accounts for more than 26% of global greenhouse gas emissions and therefore should bear the greatest climate responsibility.” This view suggests China’s current annual emissions alone make it primarily accountable for global warming and that its mitigation efforts are insufficient or ineffective.
Fact check
This report draws on a combination of internationally recognized data sources and official Chinese statistics. International sources include the International Energy Agency (IEA) and Our World in Data (OWID), while Chinese data are drawn from the Ministry of Ecology and Environment and national carbon market reports. Rather than relying on a single indicator, this report compares cumulative emissions, per-capita contributions, carbon intensity, energy structure, and policy implementation to examine the notion of national responsibility from scientific, equitable, and developmental perspectives.
1.Cumulative emissions and climate impacts
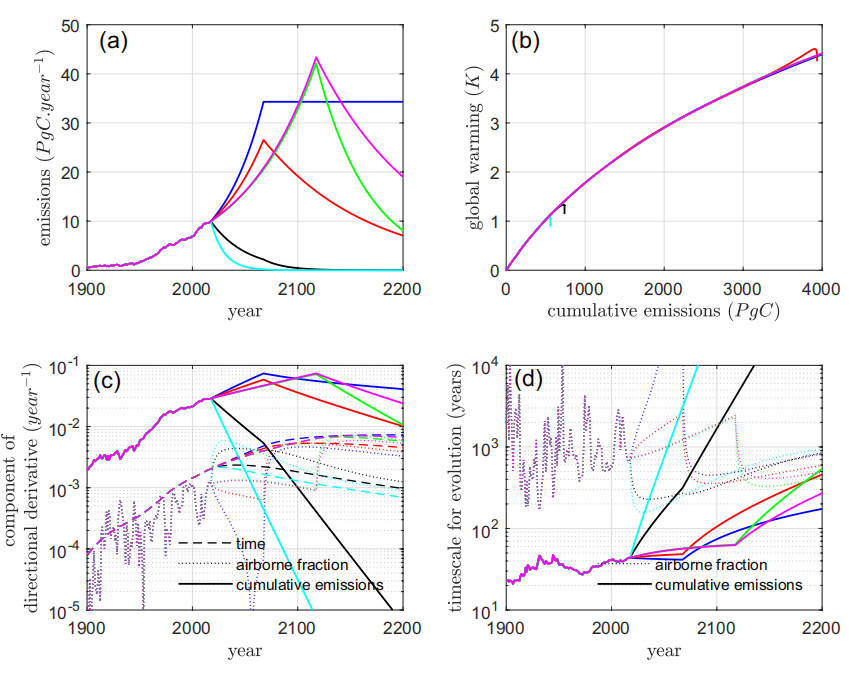
Multiple climate studies and modeling analyses indicate that long-term global warming and atmospheric CO2 concentrations are closely linked to cumulative emissions, rather than being determined solely by a single year’s emission peak or annual emission rate. As illustrated in Figure 1, although different emission pathways exhibit significant variations in peak timing and mitigation rates, the ultimate extent of global warming remains highly consistent when cumulative emissions are equivalent, demonstrating a clear property of “path-independence”[1]. This pattern has been repeatedly validated across various climate models, highlighting that the climate system is far more sensitive to total cumulative emissions than to short-term fluctuations.
From the perspective of long-term climate impacts and responsibility assessment, historical cumulative emissions constitute the core indicator for determining a country’s contribution to the rise in global greenhouse gas concentrations, rather than emissions in any single year. Consequently, allocating climate responsibility based solely on a particular year’s emissions neglects historical contributions and is inconsistent with the fundamental principles of scientifically assessing climate responsibility.
Figure 1. Scientific Evidence for Global Warming Dominated by Cumulative CO2 Emissions: (a) Different emission pathways; (b) Quasi-linear relationship between warming and cumulative emissions; (c) Sensitivity analysis of cumulative emissions’ dominant effect; (d) Comparison of time scales between cumulative emissions and atmospheric processes. (Note: a – different emission pathways; b – warming is primarily determined by cumulative emissions; c – cumulative emissions exert the greatest influence; d – cumulative emissions change most rapidly.)
2.Cumulativeemissions and the equitableallocation of climate responsibility
Building on the scientific conclusion that long-term global warming is primarily driven by cumulative emissions rather than annual emission peaks or short-term fluctuations, differences in cumulative emissions among countries constitute a key indicator for assessing each country’s contribution to current atmospheric CO₂ concentrations. Cumulative emissions represent the total volume of greenhouse gases added to the atmosphere since the onset of industrialization, and therefore provide the most scientifically robust basis for allocating long-term climate responsibility.
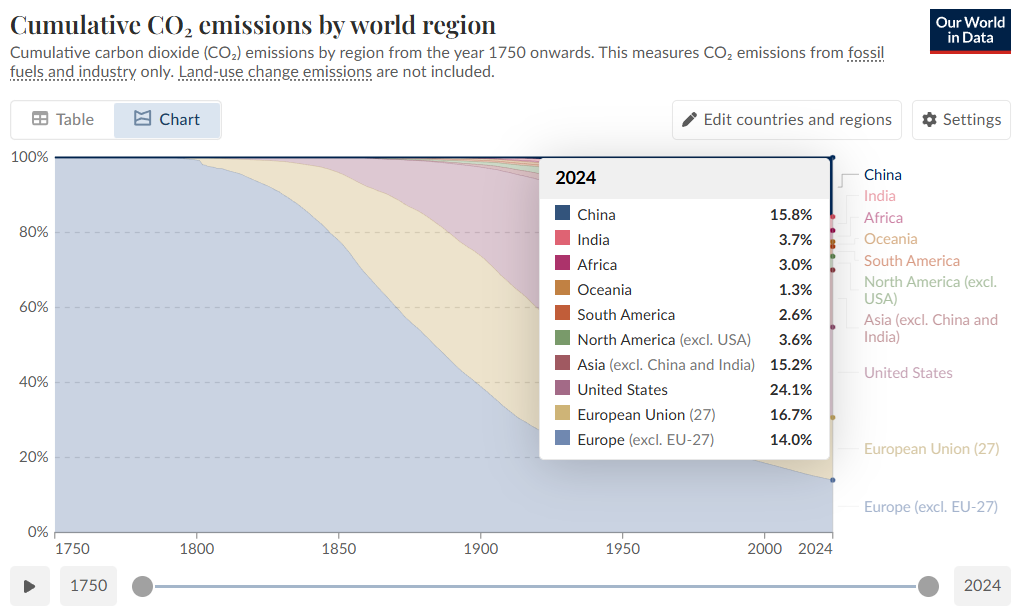
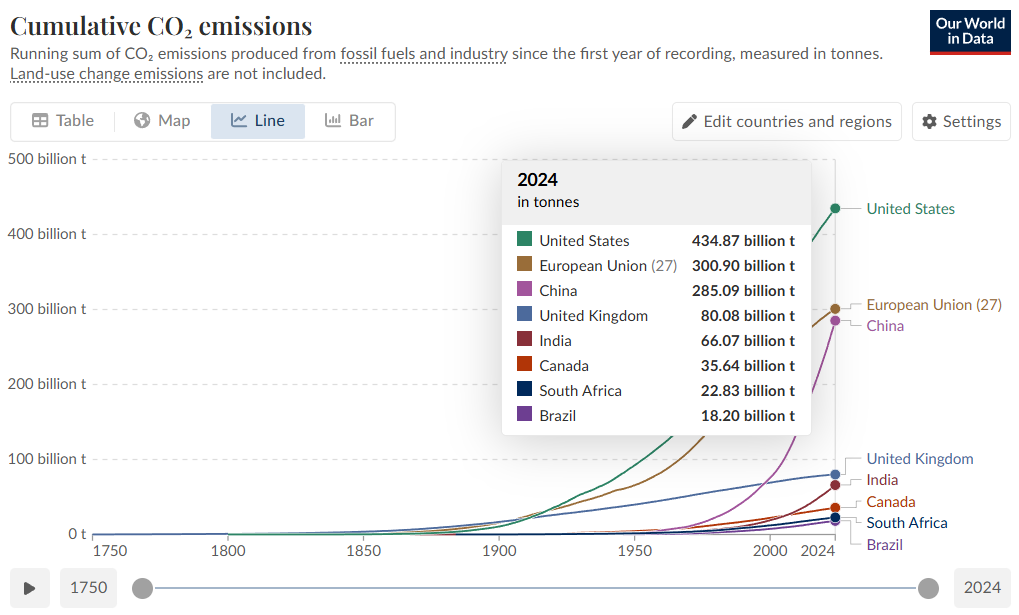
According to the latest publicly available dataset from Our World in Data (as of 2024), which covers CO₂ emissions from fossil fuel combustion and industrial processes from 1751 to 2024 (excluding land-use change), significant disparities exist among countries and regions in their cumulative contributions to atmospheric CO₂ (see Figure 2 and Figure 3):
The United Statesis the largest cumulative emitter, accounting for 1% of global cumulative emissions, with a total of approximately 434.87 billion tonnes;
The European Union (27)accounts for 7%, totaling around 300.90 billion tonnes;
Chinaaccounts for 8%, totaling approximately 285.09 billion tonnes;
Other major contributors include the United Kingdom(08 billion tonnes), India (66.07 billion tonnes), Canada (35.64 billion tonnes), South Africa (22.83 billion tonnes), and Brazil (18.20 billion tonnes).
At the regional scale (Figure 2), Asia (excluding China and India) accounts for 15.2% of cumulative emissions, Europe (excluding EU-27) accounts for 14.0%, and North America (excluding the United States) accounts for 3.6%. Other regions—such as Africa (3.0%), South America (2.6%), and Oceania (1.3%)—represent substantially smaller shares of total cumulative emissions.
In other words, the cumulative emissions share of the United States (24.1%) is approximately 1.53 times that of China (15.8%), indicating that the United States has made a significantly higher contribution to the long-term accumulation of atmospheric CO₂. This cumulative difference—rather than annual emissions—is the principal determinant of current global temperature levels and the scientific basis for assessing long-term climate responsibility. Assessing the climate responsibility of China or other developing economies solely on the basis of current annual emissions neglects nearly two centuries of structural accumulation resulting from historical industrialization.
These principles are explicitly embedded in international climate governance frameworks. Both the United Nations Framework Convention on Climate Change (UNFCCC) and the Paris Agreement affirm the principle of Common but Differentiated Responsibilities (CBDR), under which climate responsibility should be allocated based on cumulative emissions, national capabilities, and level of development. Using annual emissions alone as the primary basis for determining responsibility departs from both scientific accuracy and equity—particularly in the context of large developing economies undergoing continued industrialization.
Figure 2. Cumulative CO₂ emissions by world region.
Figure 3. Cumulative CO₂ emissions.
3. Critical complementary metrics
While annual total emissions are often cited in climate discussions, they do not account for disparities in population size, economic structure, or development stage. To assess climate responsibility more accurately and fairly, per capita emissions and carbon intensity offer critical complementary metrics.
3.1Per capita emissions
Per capita carbon emissions refer to the average amount of carbon emissions generated per person within a country. This indicator is one of several metrics used in international climate assessments when discussing emission reductions and national emission profiles.
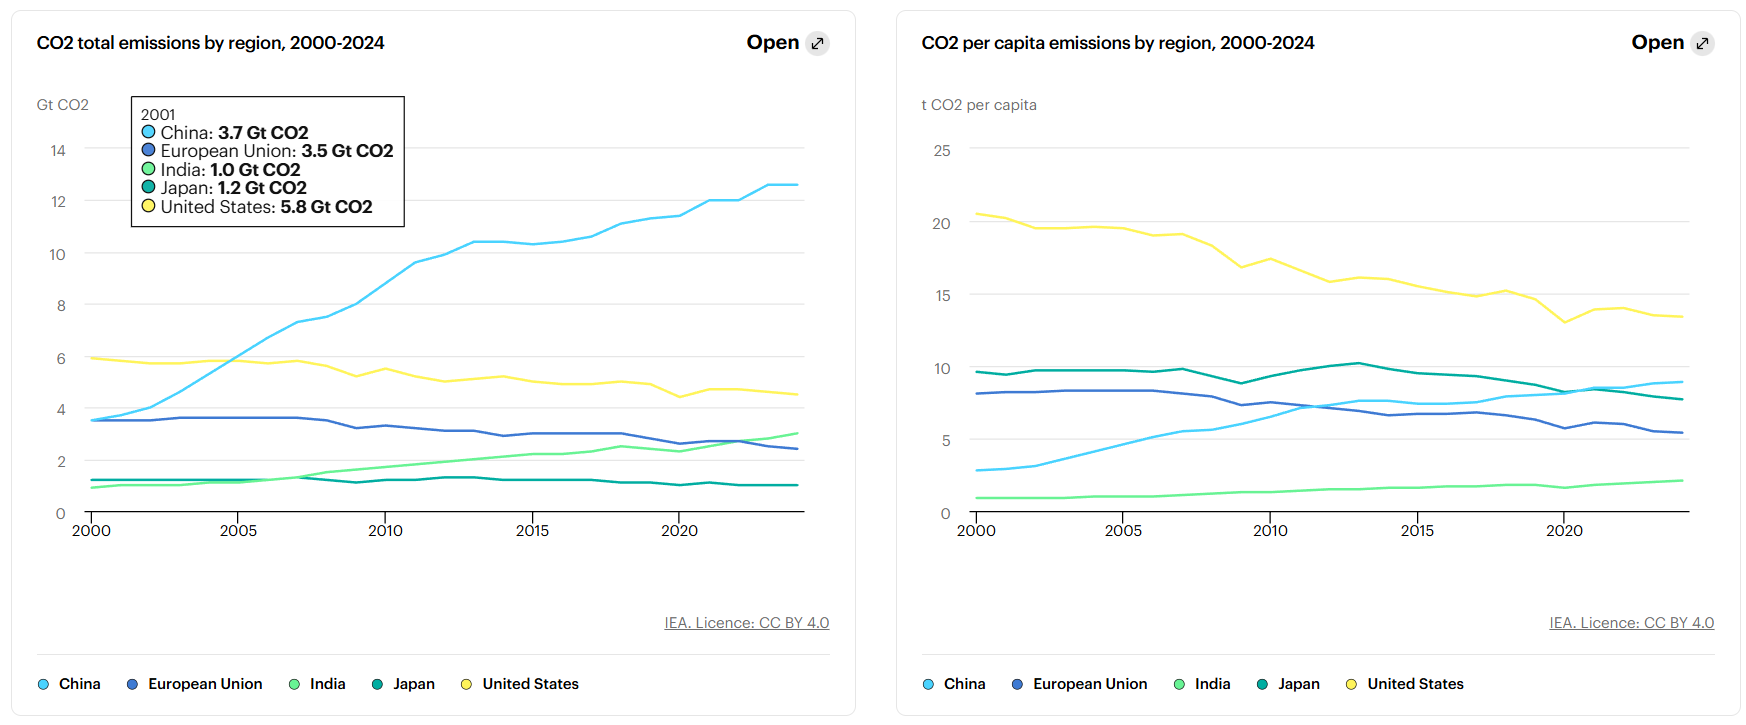
According to publicly available databases, per capita CO2 emissions in the United States were approximately 14.21 t/person in 2022, while China’s per capita emissions for the same year were about 8.89 t/person; another source indicates that China’s per capita CO2 emissions in 2023 reached approximately 9.40 t/person. These data demonstrate that China’ s per capita emissions are far lower than those of the United States and remain at a developing country level.
Moreover, data from the International Energy Agency (IEA) presented in Figure 4 show that between 2000 and 2024, there were significant differences in total and per-capita CO2 emissions across regions. This further illustrates that declaring the “largest emitter” solely based on annual totals disregards population size and development stage considerations.
Figure 4. IEA. Total and Per Capita CO2 Emissions by Region, 2000–2024. (Note: The figure shows that China’s total emissions are high, but its per-capita emissions are lower than those of the United States.)
3.2 Carbon Intensity Reduction
When assessing a country’s mitigation performance and climate contribution, it is essential to consider multiple indicators, including absolute emissions, carbon intensity trends, and cumulative historical emissions, rather than relying solely on annual totals.
According to the IPCC, carbon intensity can be understood through the Kaya decomposition analysis, where CO₂ emissions (F) are determined by population (P), GDP per capita (G/P), the energy intensity of GDP (E/G), and the carbon intensity of energy (F/E). In this framework, carbon intensity refers to the emissions associated with economic output, represented by the combined effect of energy intensity (E/G) and the carbon intensity of energy (F/E).
Taking China as an example, official Chinese data show that the country’s average electricity carbon emission factor decreased from 0.6205 kgCO2e/kWh in 2023 to 0.5777 kgCO2e/kWh in 2024, a 6.9% reduction. This reflects measurable progress in the power sector through energy structure optimization, clean energy deployment, and efficiency gains.
Therefore, when assessing a country’ s mitigation performance and climate contribution, it is essential to consider multiple indicators, including absolute emissions, carbon intensity trends, and cumulative historical emissions, rather than relying solely on annual totals
4. Energy structure adjustments and mitigation progress
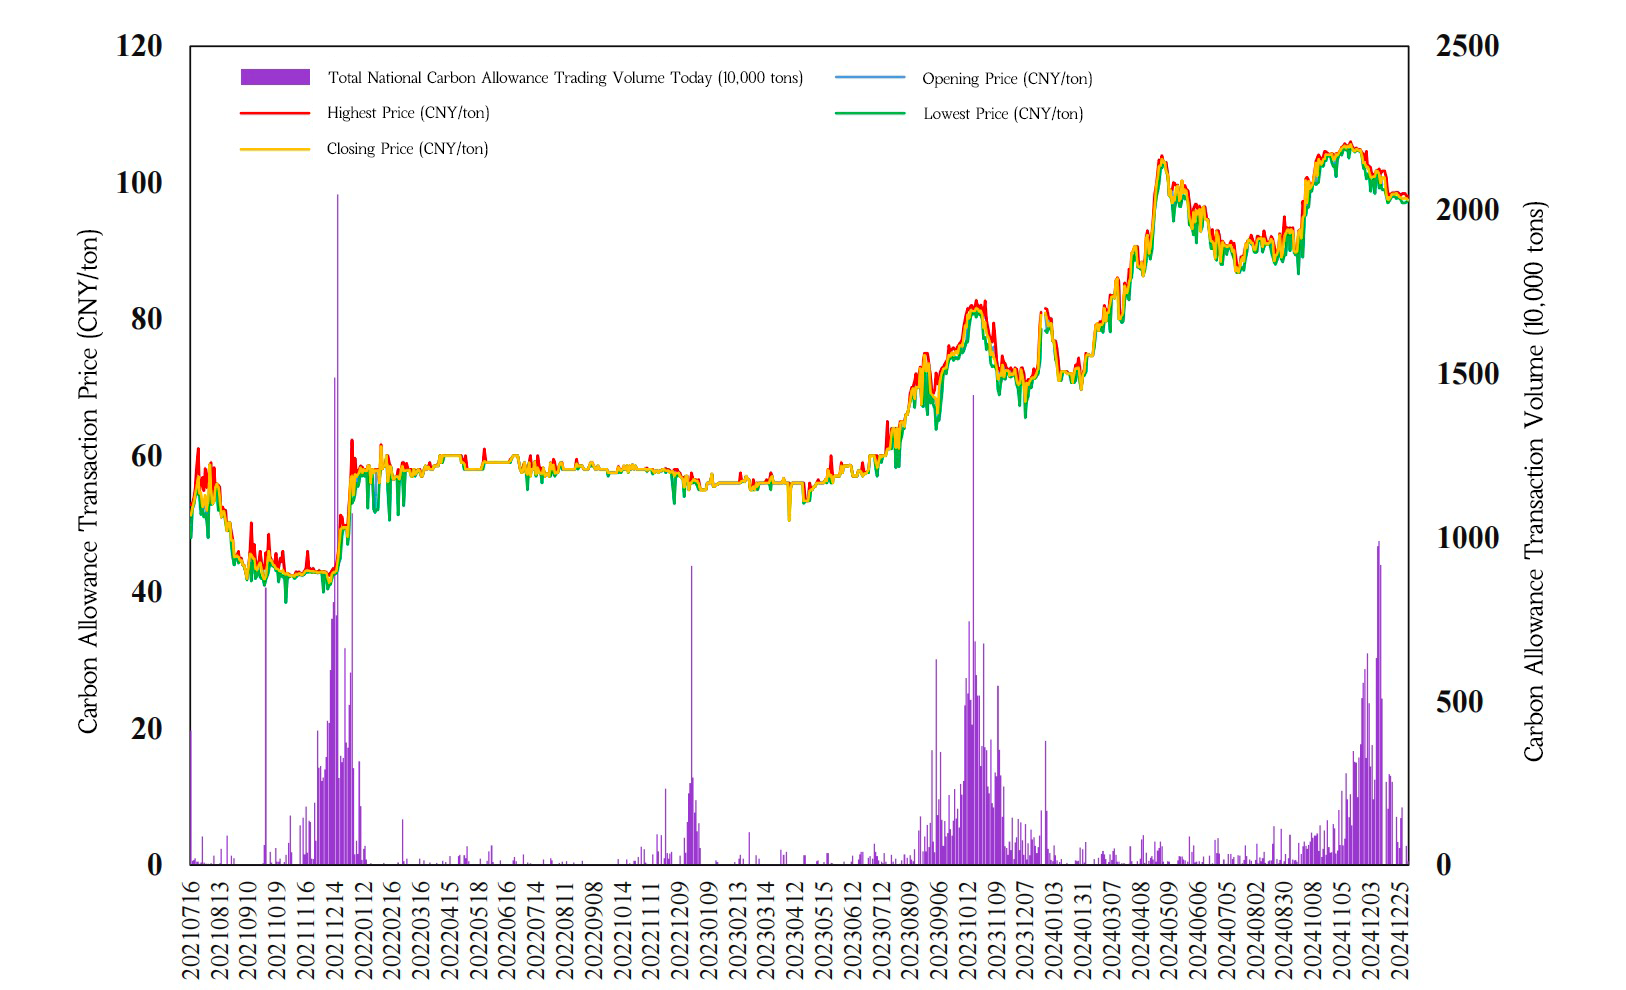
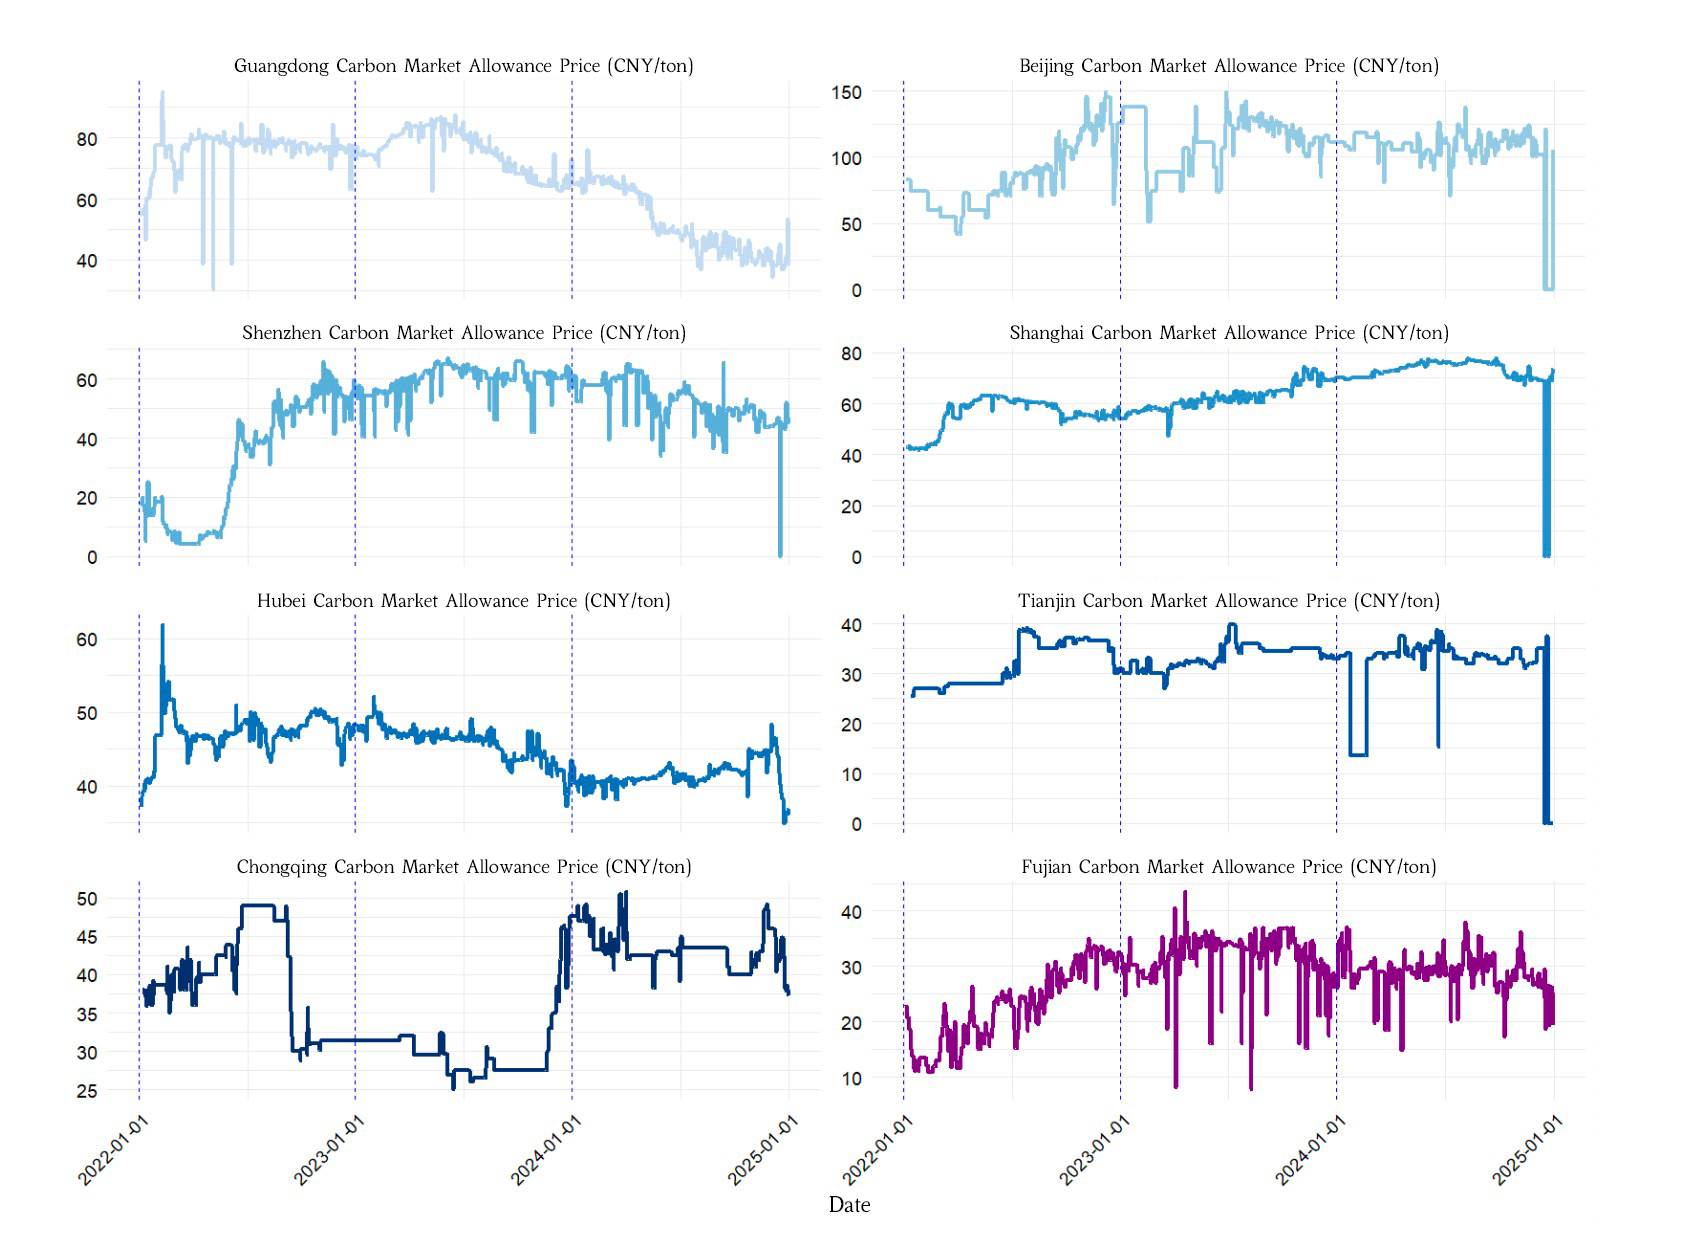
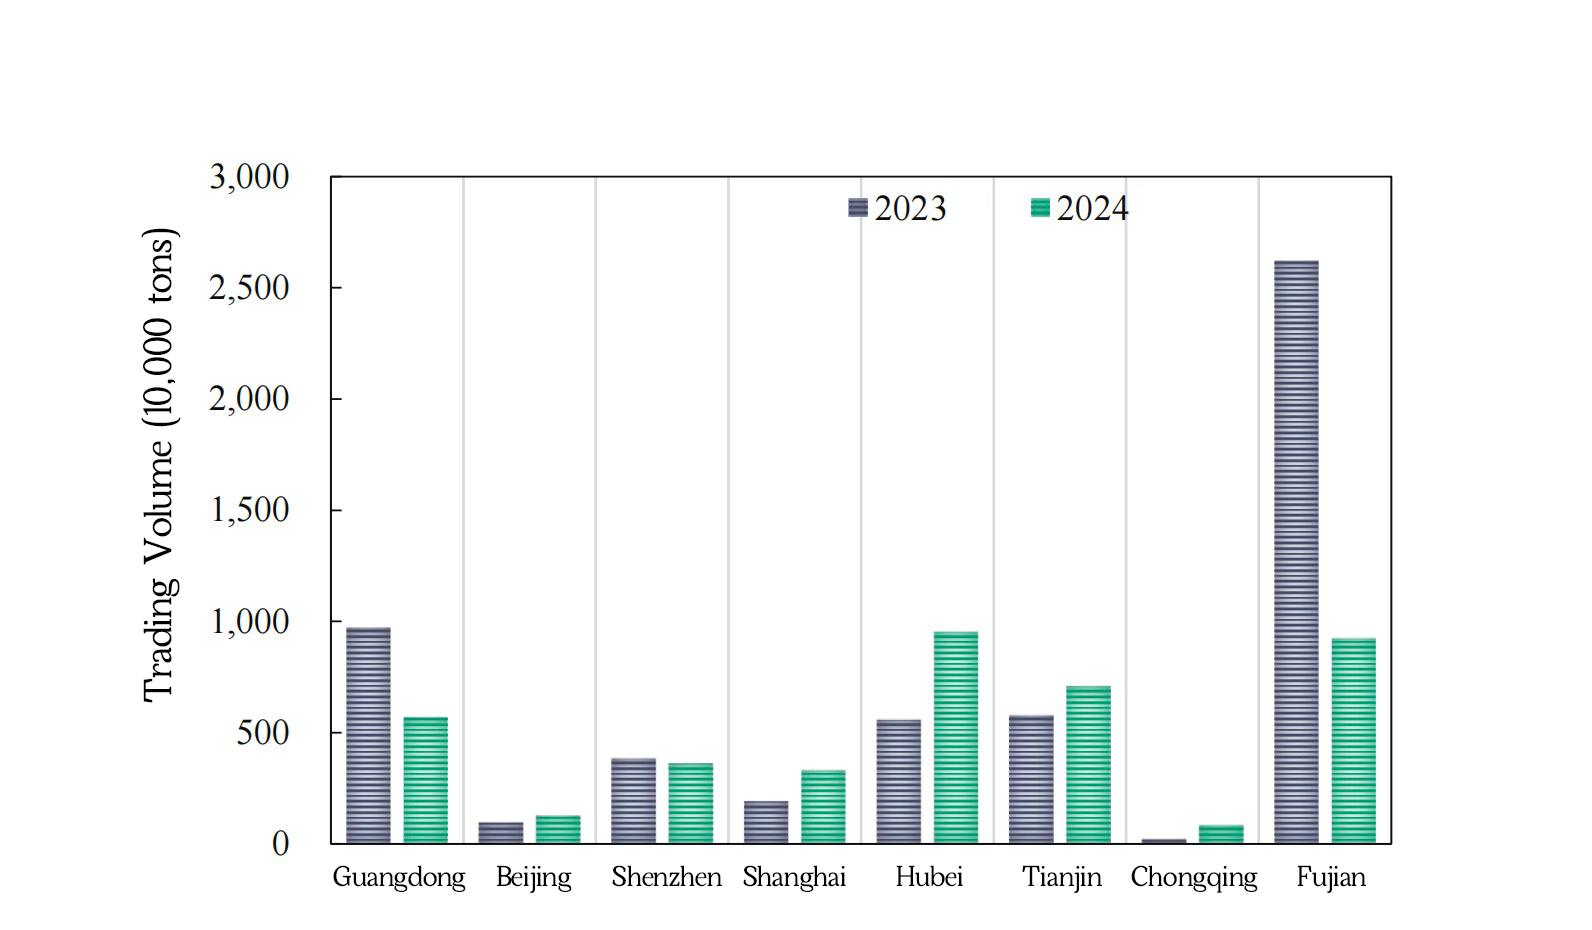
China’s energy structure has been continuously optimized. From 2005 to 2024, the share of fossil energy decreased from 72.4% to 53.2%, while non-fossil energy increased from 7.4% to 17.9%. Installed capacity of wind, solar, hydro, and biomass exceeded 50% of total national power capacity. Data from China’s carbon market indicate that in 2024, carbon prices surpassed 100 CNY/t for the first time, with an annual average of 91.8 CNY/t, up 43.4% year-on-year. Local carbon market pilots show differences in mitigation progress but an overall upward trend, as illustrated in Figures 5, 6, and 7.[2]
Figure 5. Daily Allowance Trading Prices and Volumes in the National Carbon Market.(The English caption is translated by the fact-checker. Please refer to the reference materials for traceability.)
Figure 6. Daily Carbon Prices in China’s Pilot Carbon Markets, 2021–2024. The English caption is translated by the fact-checker. Please refer to the reference materials for traceability.)
Figure 7. Annual Trading Volume of China’s Pilot Carbon Markets, 2023–2024. The English caption is translated by the fact-checker. Please refer to the reference materials for traceability.)
These developments reflect China’s ongoing structural transition toward a lower-carbon energy system, supported by both policy-driven market mechanisms and large-scale deployment of clean energy. The overall trajectory demonstrates consistent efforts to reduce carbon intensity, shift away from fossil fuels, and build institutional capacity for long-term mitigation. Taken together, these indicators collectively demonstrate that China’s mitigation efforts are both measurable and ongoing.
Conclusion
Assessing a country’s climate responsibility requires a comprehensive and scientifically grounded approach. The international climate governance system emphasizes the principles of Common but Differentiated Responsibilities (CBDR). Within this structure, developed countries with historically high emissions bear a greater burden for mitigation.
Relying exclusively on annual emissions overlooks key contextual factors such as population size, per-capita emissions, economic structure, carbon intensity, energy pathways, and stages of development. This approach risks conflating absolute emission volume with mitigation effectiveness and may lead to uncontextualized characterizations of populous countries as major emitters without adequately considering the significance of their mitigation strategies and energy transitions.
To ensure fairness and scientific rigor, assessments of national climate responsibility should adopt a multi-indicator approach. This includes cumulative emissions, per-capita emissions, carbon intensity trends, energy structure, clean energy adoption, and institutional implementation. Emphasis should be placed on long-term trajectories rather than single-year fluctuations, and on actual mitigation outcomes rather than raw emission volumes.
Verdict
False.
Have a questionable video or claim? Submit it to Fact Hunter’s investigation team at [therealfacthunter@outlook.com].
Primary Fact Checker: WANG Shifeng, HAN Lin
Secondary Fact Checker: LIAO Qin, MA Xianzhi
References
[1] Cumulative emissions accounting of greenhouse gases due to path independence for a sufficiently rapid emissions cycle. Climate Dynamics (2021) [J] 57:787–798. https://doi.org/10.1007/s00382-021-05739-3.
[2] Global and China Carbon Market Review and Outlook (2025) [R]. Beijing: Beijing Institute of Technology, Center for Energy and Environmental Policy Research, 2025. (Energy Economics Forecast and Outlook Research Report, CEEP-BIT-2025-008) [2025-01-12].